Marketing Data
The first in a series of forthcoming analysis on the impact of the MRC OOH Measurement Standards — outlining the transformative changes and potential outcomes all OOH media stakeholders – advertisers, media owners, and agencies – should be considering as the industry of the real world evolves and competes in a digital media measurement environment.
Author’s Note:
Over the last few years, the majority of my time at Motionworks has been spent developing innovations in television and radio measurement. My career has always centered around media research across various channels, but having spent 6 years at the helm of Geopath, Out-of-Home holds a special place in my heart. I was one of the many participants in the development of Phase 1 of the MRC OOH Measurement Standards – which will serve as the benchmark for the industry until Phase 2 is introduced. Therefore, I believe it is crucial for the OOH industry—both buyers and sellers—to understand the impact of these standards on the currency and their businesses. This knowledge will position them for success in this evolving landscape.
*The percent increases for both formats were updated on 6/5/24 as there was a miscalculation present from a prior version of this publication.
The MRC Measurement Standard Timeline
In April 2024, after five years of development, the Media Rating Council (MRC) released a set of standards for Out-of-Home (OOH) measurement. Much like the Out-of-Home Advertising Association’s (OAAA) Measurement Guidelines that were released in May of 2021, the MRC standards suggest a move away from the current global gold standard of measurement, Likelihood-to-See (LTS), and towards a less stringent Opportunity-to-See (OTS) metric that does not include the steps required to measure the audience consuming the advertising message.
MRC President George Ivie has announced that a second phase of the OOH standards is expected within the next year, aiming to refine these measures beyond, as he put it in a recent MediaPost article, “The Lowest Common Denominator.” However, there has been limited public discussion on the way in which Phase 1 of these standards might affect the OOH impression metrics used in transactions today and how businesses can prepare for these changes.
Critically, Euan Mackay, Chief Strategy Officer at Route Research, pointed out that important factors to OOH measurement are contradictory or ambiguous within the standards, particularly regarding directionality and the precise development of viewsheds. For our analysis, we will overlook these complexities and concentrate on the implications of applying these standards.
The New MRC OOH Measurement Standards Implications
A hypothetical (but realistic) example:
Consider a Static Bulletin and a Static Transit Shelter both appearing along the right-hand side of the same stretch of roadway…
The bulletin is the standard 14 ft X 48 ft and the shelter is 6 ft X 4 ft. Please consider the following image for the difference in scale of these two inventory types:
On this hypothetical stretch of road, there are 100,000 vehicles in an average week traveling in the correct direction to see the advertising. Assuming each vehicle carries 1.5 people, this results in a weekly circulation of 150,000 people passing by the two media locations.
The larger bulletin is visible from 1,000 feet away, while the transit shelter is only visible from 100 feet. At a speed of 30 miles per hour, individuals are within viewing distance of the bulletin for 22.7 seconds and the transit shelter for 2.3 seconds.
Despite the longer dwell time and larger size of the bulletin, both the bulletin and the transit shelter have identical Opportunity-to-See (OTS) metrics. This uniform metric does not accurately reflect the different abilities of these media to convey the advertising message to the audience.
To address this discrepancy, the OOH industry globally and in the US has applied a probability of noting to each location. In the US, this probability metric is called the Visibility Adjustment Index (VAI). This metric, known globally as Visibility Adjusted Contact (VAC) and referred to by Geopath in the US as an “audience impression” or “Likelihood-to-See (LTS) impression,” accounts for various factors. These include size, distance, dwell time, relative orientation, and location within the field of view, all based on eye-tracking studies. The probability of noting represents the percentage of people likely to look at the advertisement given the opportunity.
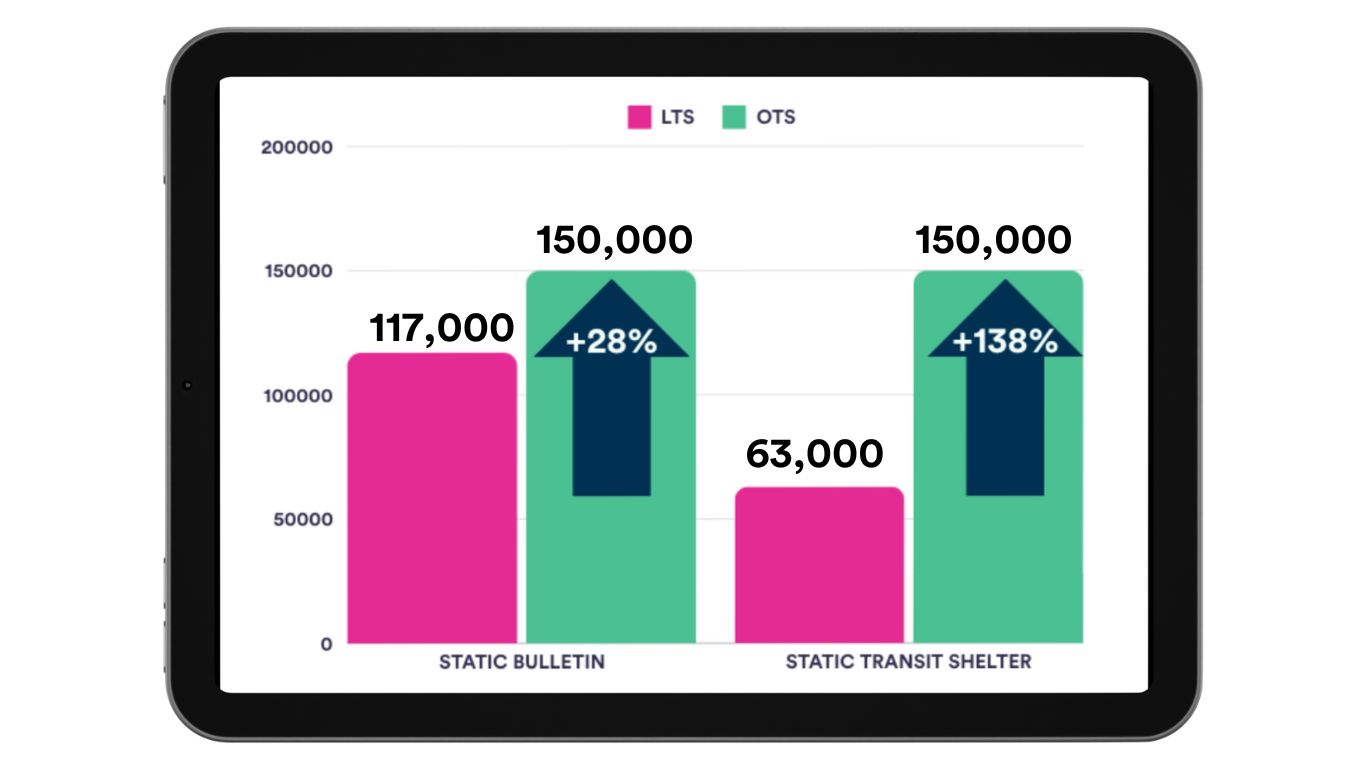
For this exercise, let’s assume the probability of noting for the bulletin is 78% and the transit shelter is 42%. The resulting LTS impressions for these formats for an average week are:

An OTS metric removes these adjustments. As a result, the ‘impressions’ on these two formats both end up being greater, but they also end up being identical:
The increase in impressions is not uniform across different formats. In this example, the static billboard sees an increase of 28%, while the transit shelter receives a 138% increase.*

To reiterate, using OTS metrics, a static transit shelter, which covers 24 square feet, registers the same number of impressions as a much larger static bulletin that spans 672 square feet—a 28-fold difference in size. This highlights significant disparities in how impressions are calculated and reported under the new standards. Adding in the complexities of digital media, the disparity between OTS and LTS becomes even more extreme.
Potential Outcomes of OOH Industry Adoption of MRC Measurement Standards
The significant shift in measurement standards could profoundly impact the Out-of-Home (OOH) advertising channel, raising several pressing questions:
- CPMs and Pricing: If an advertiser previously paid $189 for a static transit shelter at a $3 CPM, what happens under the new standards? Will they continue paying a $3 CPM but for a higher overall cost of $450, or will the CPM adjust downwards to $1.95?
- Selling Programmatically: For transit shelters for example, will the cost per thousand impressions (CPM) in the exchanges remain the same under the OTS metric as it was under the LTS metric? This could mean higher earnings for the exchange and transit shelter owner but reduced value for the buyers.
- Campaign Goals: Will buyers hit their impression goals by buying less inventory, and therefore, decrease their OOH spend?
- Adjustment Confusion: Will buyers revert to curating their own custom adjustment factors by format type as they did in the past before Geopath embraced the VAI?
- Decreased Impact: Will the channel seem less impactful in driving outcomes? When 10,000 impressions used to drive 100 store visits, how do we position that it now takes 15,000 impressions?
It’s important to note that these scenarios assume the continued use of established viewsheds and traffic directionality as per Geopath’s current methodology. Any changes to these elements would likely amplify the impact of the new standards even further.
As the OOH industry navigates through these transformative measurement changes, it is essential for all stakeholders—advertisers, agencies, and media owners—to actively engage with the evolving standards and get involved with the writing of Phase 2. The shift from LTS to OTS metrics not only recalibrates how impressions are calculated but also prompts a reevaluation of strategy across the spectrum of OOH advertising.
Together, through collaborative efforts and a commitment to understanding these new metrics, the OOH industry can continue to thrive in a landscape with increasing data fragmentation, technological advancements, new formats, and greater competition.
If you would like to get involved in this conversation or discuss how the standards may impact your business, we would love to hear from you. Please contact [email protected]

 Back
Back


