How is this different from Geopath?
Your campaign report and Motionworks profiles will differ from Geopath planned impressions. Motionworks strives to adhere to the published industry guidance on measurement practice, including Geopath's own published guidance. In practice there are differences in execution. They fall into three categories, outlined below.
The power of Motionworks is that it does not set policy on measurement. It puts the tools in the hands of the user to determine which variables best fit their needs, be it viewshed creation, speed assumptions, occupancy, or others.
A currency sets policy. A utility does not.
Geopath is a currency. It must make policy decisions that affect impression yield, like speed of travel assumptions or how to implement viewability guidance in practice. These decisions can have a significant impact on overall viewership, especially for digital inventory, where dwell becomes a much larger factor. Motionworks does not take a position. We understand how people move around, and we provide the utility for our customers to make their own policy decisions on these settings that impact yield, as required for their purpose. When default settings are required, Motionworks simply uses a data-driven approach as a reference setting for user convenience.
The impression formula
Static: OTS equals the people who pass the face each week. Digital: OTS per person equals share of voice times (1 + time in view ÷ spot length), with no cap. Both systems apply these rules the same way.
The inventory
A Motionworks report measures the faces in Geopath's inventory, using Geopath's IDs, locations, sizes, place types and spot lengths. The roads, viewsheds and paths underneath those faces are Motionworks'.
The audience structure
Vehicle occupants plus pedestrians, by week, by face. Likely-to-see (LTS) is OTS times a visibility factor on both sides. This page is about OTS; the visibility factor is a separate topic.
The role
Geopath sets the planning number. A Motionworks campaign report is a measurement of what was delivered, read alongside the plan. The user chooses the inputs, viewshed, speed, occupancy, that fit the question being asked.
One difference is the population. The rest are settings.
The differences fall into two kinds. The first is the population foundation: Motionworks observes more trips past the inventory than the plan assumes. Everything else is a setting applied on top of that population: speed, distance in view, occupancy. A campaign report carries each setting with a Motionworks default and a plan-equivalent value. Speed is the first setting the user can change directly; distance in view and occupancy follow in sequence. The figures below are for digital faces, where the settings enter the formula. On static faces OTS is people, so only the population difference applies. Each input is shown in detail further down.
What the model observes. Not a setting. Before any speed or distance assumption, Motionworks counts more people passing the inventory than the plan: 16% more across all faces, 24% more on digital faces. On digital faces that alone puts delivered OTS 21% above the plan; the three points between the two are the digital formula, which credits each added person by their time in view, and the people added are mostly on faster roads.
Assumptions applied on top of the population. Shorter time in view means fewer repeat loops per person. These are what move the delivered number below the plan, and these are the user's to set.
| Input | Kind | Motionworks default | Plan-equivalent value | Effect on digital OTS, % of plan |
|---|---|---|---|---|
| People passing | Population foundation | Every road in the viewshed, observed volumes | Assigned segments, modeled volumes | +20.8 |
| Speed | Setting | Observed speed on the road as driven | Modeled road speed per segment | -26.9 |
| Distance in view | Setting | Road from which the face is visible | Straight approach line from maximum viewing distance | -18.2 |
| Occupancy | Setting | Motionworks vehicle occupancy | Plan occupancy | included in people |
| Remainder | Formula residual and rounding | -5.3 | ||
| Motionworks defaults, all inputs | Population foundation + Motionworks settings | 70.4 | ||
| Motionworks population, plan settings | Population foundation + plan-equivalent speed and distance, after the formula remainder | about 115 | ||
Population foundation: what the model observesSetting: an assumption the user can change
Digital faces, national roadside inventory, share of Geopath plan OTS. Run with the Motionworks population and the plan's speed and distance settings, delivered digital OTS lands above the plan, about 15% after the formula remainder. Run with the Motionworks defaults, it lands below. The settings decide which, and the settings are the user's.
01 · Population foundation
We count every road the sign can be seen from.
Geopath assigns audited road segments to each face. Motionworks builds a viewshed for each face, checks line of sight every 2 meters along every nearby road, and counts the people on each road where the face is in view. The result is 16% more people across the national roadside inventory.
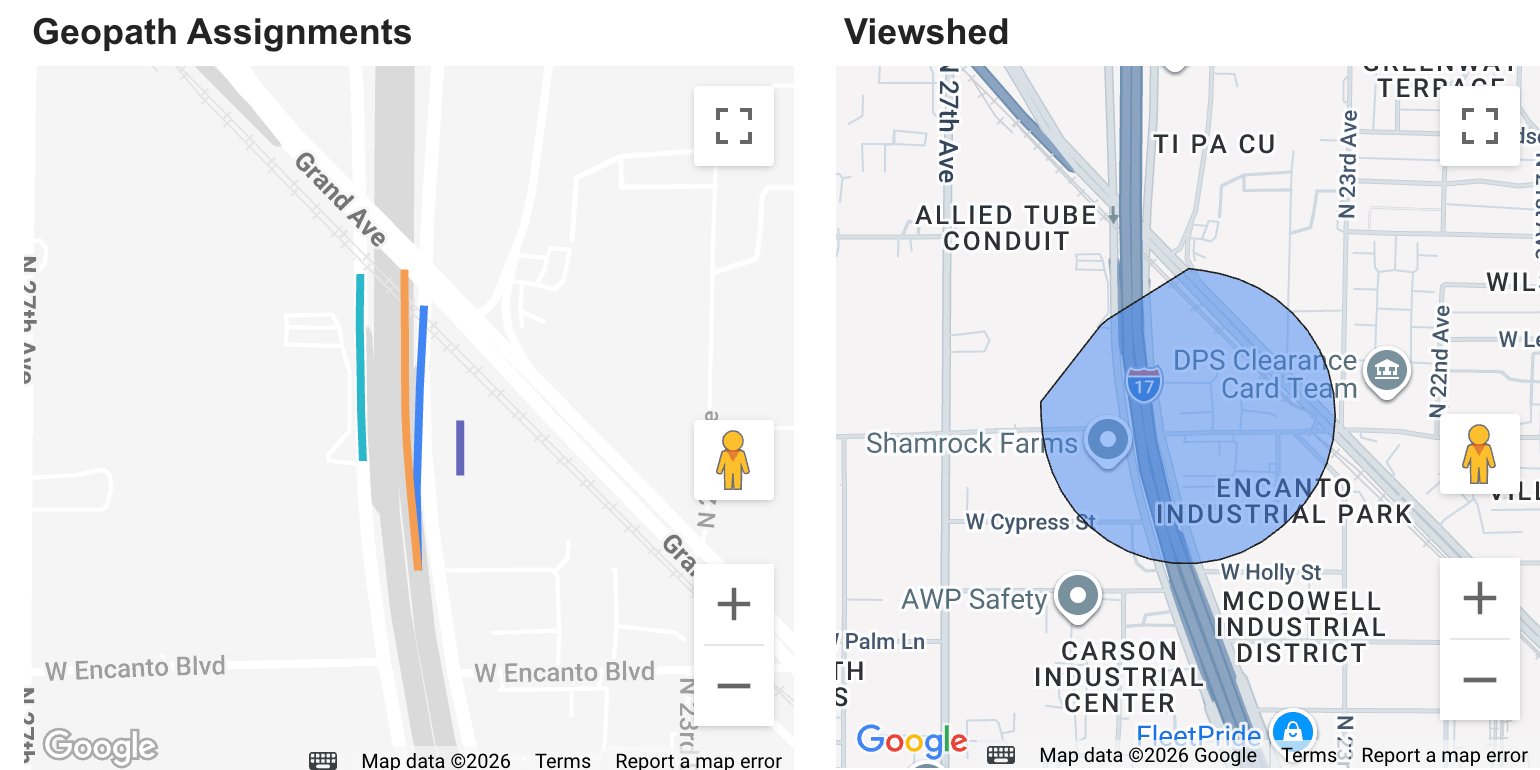
Left: the four road segments assigned to this face in Geopath's inventory. Right: the Motionworks viewshed for the same face. Every road inside the viewshed with a clear sightline carries audience. The assigned segments are a subset of that, so the two systems start from different road sets before any traffic volume is compared.
| Where the people difference comes from | Share of faces affected | Effect on OTS, % of Geopath |
|---|---|---|
| Roads in the viewshed that are not assigned in Geopath | About 159,000 roads, mostly faster roads (40 mph average) | +12.4 |
| Assigned segments outside the viewshed | About 84,000 segments, mostly slower roads (19 mph average) | -4.7 |
| Same road, Motionworks volume higher | Matched roads where our traffic count is higher | +18.4 |
| Same road, Motionworks volume lower | Matched roads where our traffic count is lower | -10.5 |
| Net people, as OTS | 16.0% more people pass; on OTS the people effect is 15.6 because OTS weights each person by the digital formula | +15.6 |
Fully matched faces
Every assigned segment has a Motionworks road. The difference is traffic volume only.
Partly matched faces
The viewshed adds roads that are not assigned. This is the largest single source of difference.
No road in common
Different road sets entirely. A small share of faces with the largest per-face gap.
On a static face, OTS is people, so this input is the whole static difference. Per face the spread is wide: 54% of faces are higher in Motionworks, 14% within 5%, 32% lower. The median face is +8%.
02 · Setting
We use observed speeds on the road as driven.
Time in view is distance divided by speed. Geopath's speed input is a modeled road speed per segment. Motionworks uses volume-weighted speeds observed from vehicle movement on each road. On the same roads, the Motionworks input runs about 1.5x Geopath's road by road (about 1.9x on person-weighted averages), and the gap is widest in dense urban areas.
| Place type | Geopath speed input (mph) | Motionworks speed input (mph) | Typical per-road ratio |
|---|---|---|---|
| Central Business District | 8.8 | 21.5 | 1.76 |
| Urban Business | 16.9 | 39.8 | 1.83 |
| Urban | 25.3 | 48.0 | 1.66 |
| Suburban | 32.8 | 53.4 | 1.42 |
| Rural | 52.9 | 63.7 | 1.10 |
| All same roads | 25.9 | 49.4 | 1.52 |
Person-weighted averages on matched road pairs, national roadside inventory. The ratio column is computed road by road (each pair's Motionworks input over its Geopath input, weighted by people), not as the ratio of the two averages. It runs lower than the ratio of averages because the speed gap is widest on the busiest roads, which pull the averages apart more than they move the typical pair.
Checked against government sensors
Both speed inputs were compared with public traffic sensors on 10 corridors over six months: CTA bus travel time in Chicago, NYC DOT sensors in New York, and Caltrans PeMS detectors in California.
| Corridor | Government sensor | Motionworks | Geopath |
|---|---|---|---|
| N Halsted NB (Chicago) | 20 | 16.2 | 10.4 |
| N LaSalle NB (Chicago) | 17.9 | 12.8 | 7.7 |
| E Garfield EB (Chicago) | 23.2 | 27.6 | 7.4 |
| Cross Bronx EB (New York) | 27.7 | 34.3 | 21 |
| West St SB (New York) | 14.5 | 21.2 | 7 |
| I-5 NB (San Diego) | 64.9 | 68.7 | 49 |
| I-405 SB (Los Angeles) | 60 | 63.4 | 36 |
| I-880 NB (Oakland) | 64.6 | 58.1 | 45 |
| I-80 EB (Sacramento) | 69 | 68 | 44 |
| SR-99 NB (Fresno) | 63.7 | 67.3 | 57 |
Government sensorMotionworksGeopath
Ten corridors is a check, not a national validation. On four of the six freeways the sensor and Motionworks agree within 4 mph; on the Cross Bronx and I-880 the gap is about 6.5 mph. On dense arterials Motionworks is below the sensor on some streets and above it on others. We continue to expand this comparison.
03 · Setting
We count only the road from which the sign is visible.
Geopath sets distance in view from the size of the sign: a straight approach line whose length comes from the face's maximum viewing distance. Motionworks measures the length of road from which the face is actually in view, after curves, cross streets and buildings. On most faces the two agree within about 10%. On the largest faces they do not.
Geopath's approach line
Length is set by the face's diagonal and place type. It runs straight along the assigned segment's direction. Its length does not depend on how long the segment is, and it is not shortened where the view is blocked.
The Motionworks path
Line of sight is tested every 2 meters along the road with building heights. The path is the stretch of road where the test passes. Where the face is never in view, no path is published and no audience is assigned.
The shared standard. Geopath's published guidance frames media exposure through a viewshed: the area from which a face can be seen (Geopath High-level: Viewshed and Media Exposure). Motionworks applies that same visibility test to the distance-in-view input, every 2 meters along the road. In Geopath's current execution, the approach-line length is computed in a separate step from the visibility test, which is why the two inputs can differ on the same face while both follow the same guidance.
Four faces on a map
Each map shows both geometries on one real face from Geopath's October 2026 delivery. The Geopath approach line is drawn from Geopath's published formula; its length reproduces Geopath's reported time in view for that assignment.
Motionworks viewshed Motionworks path Geopath approach line Sight line Maximum viewing distance Sign
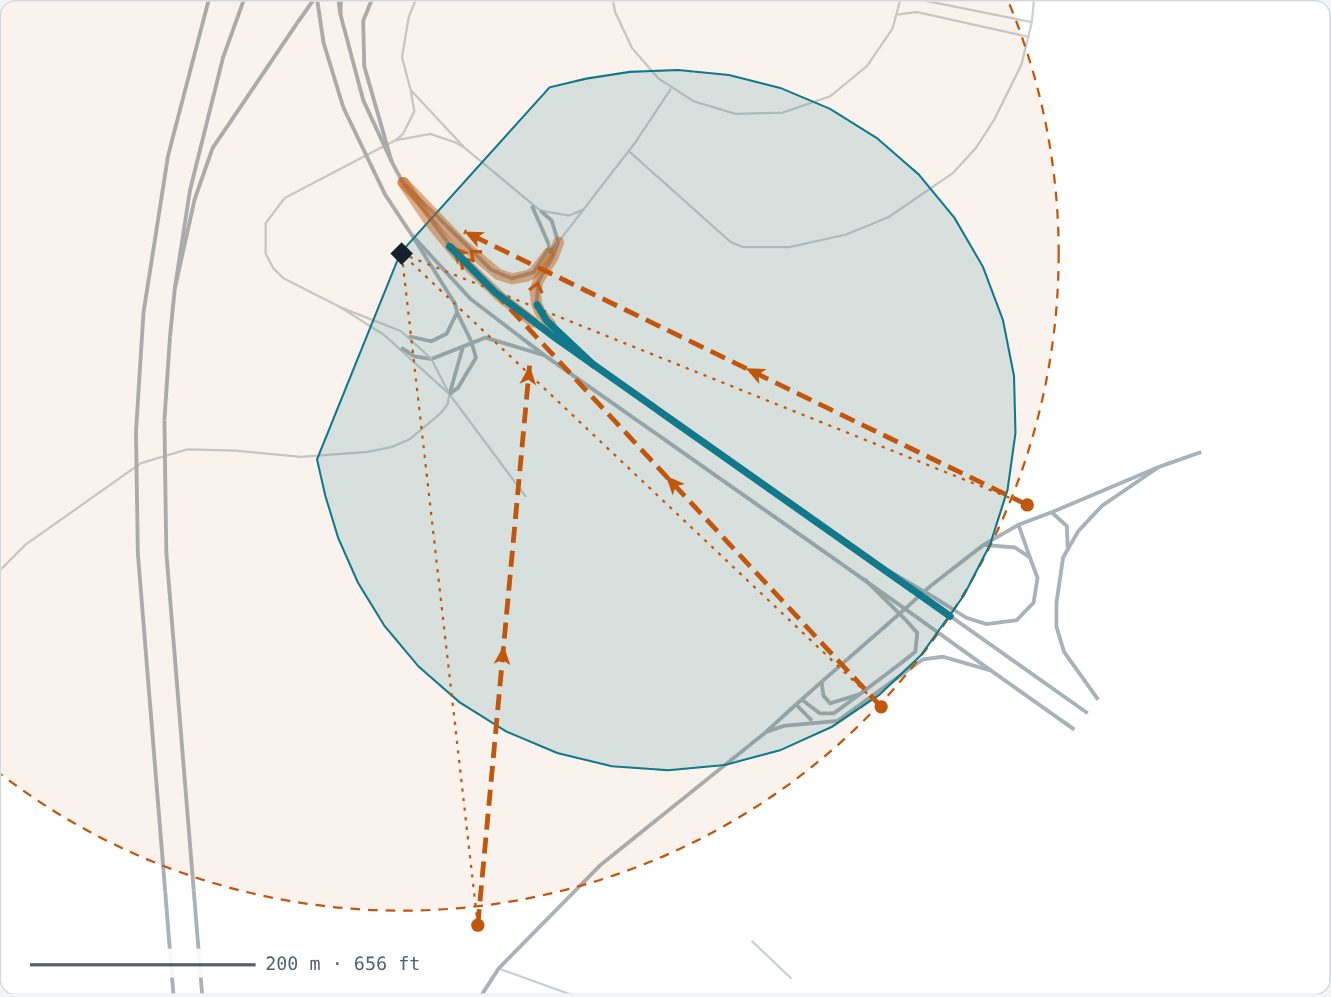
Where the two agree. The main road runs straight at the bulletin. The Motionworks path is 1,809 ft against a 1,834 ft Geopath line. At the same 56 mph, time in view matches within about 3%. The other two approaches turn away early, and the Motionworks paths stop where the road turns.
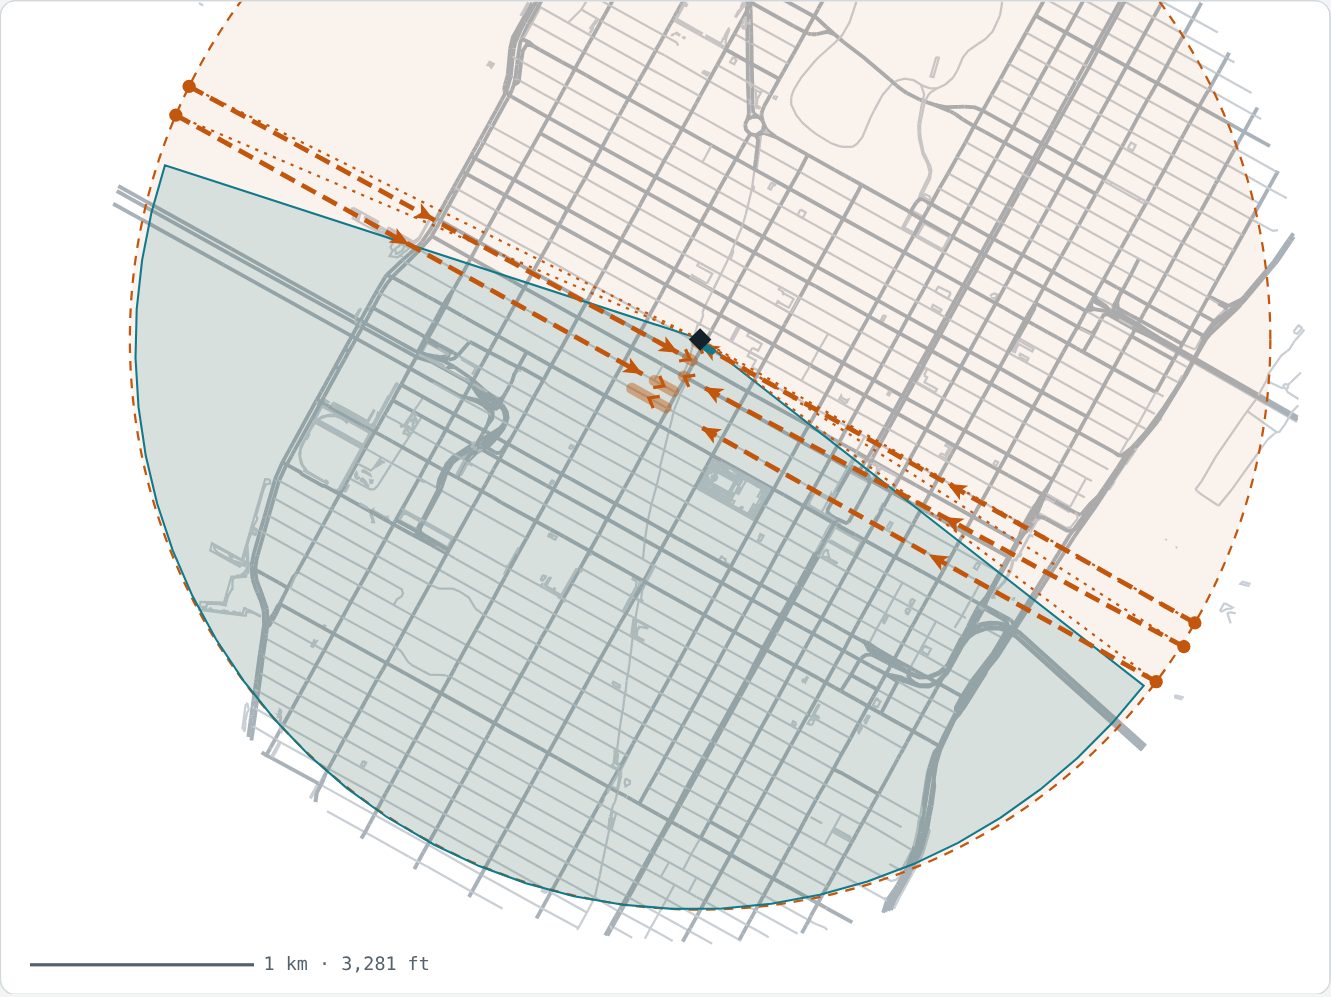
Where geometry alone differs. Speeds agree at about 6 mph. The Geopath lines run 1.5 miles crosstown, past both shorelines. The Motionworks path is 193 ft, the stretch of street where the face is in view. Vehicle time in view: 891 s against 21 s. Four of five assigned approaches have no Motionworks path because the street canyon blocks the view.
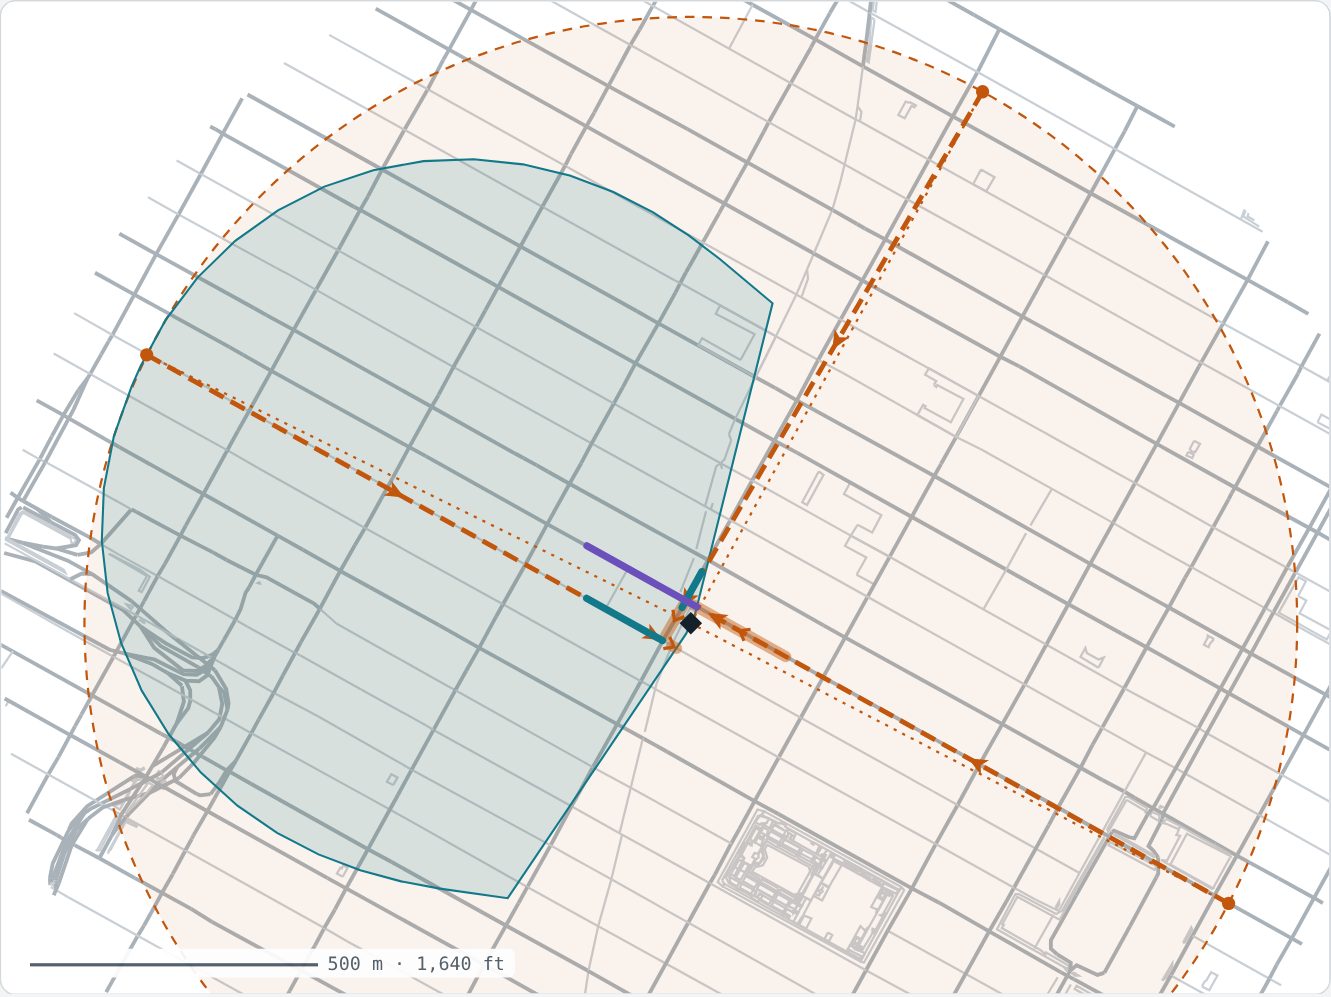
A campaign face. Three Geopath lines of about 3,400 ft at 5 to 6 mph give 437 s of vehicle time in view. The Motionworks paths are 232 and 494 ft for vehicles and 715 ft for pedestrians, and the delivered time in view is 43 s. On a digital face this difference flows straight into OTS per person.
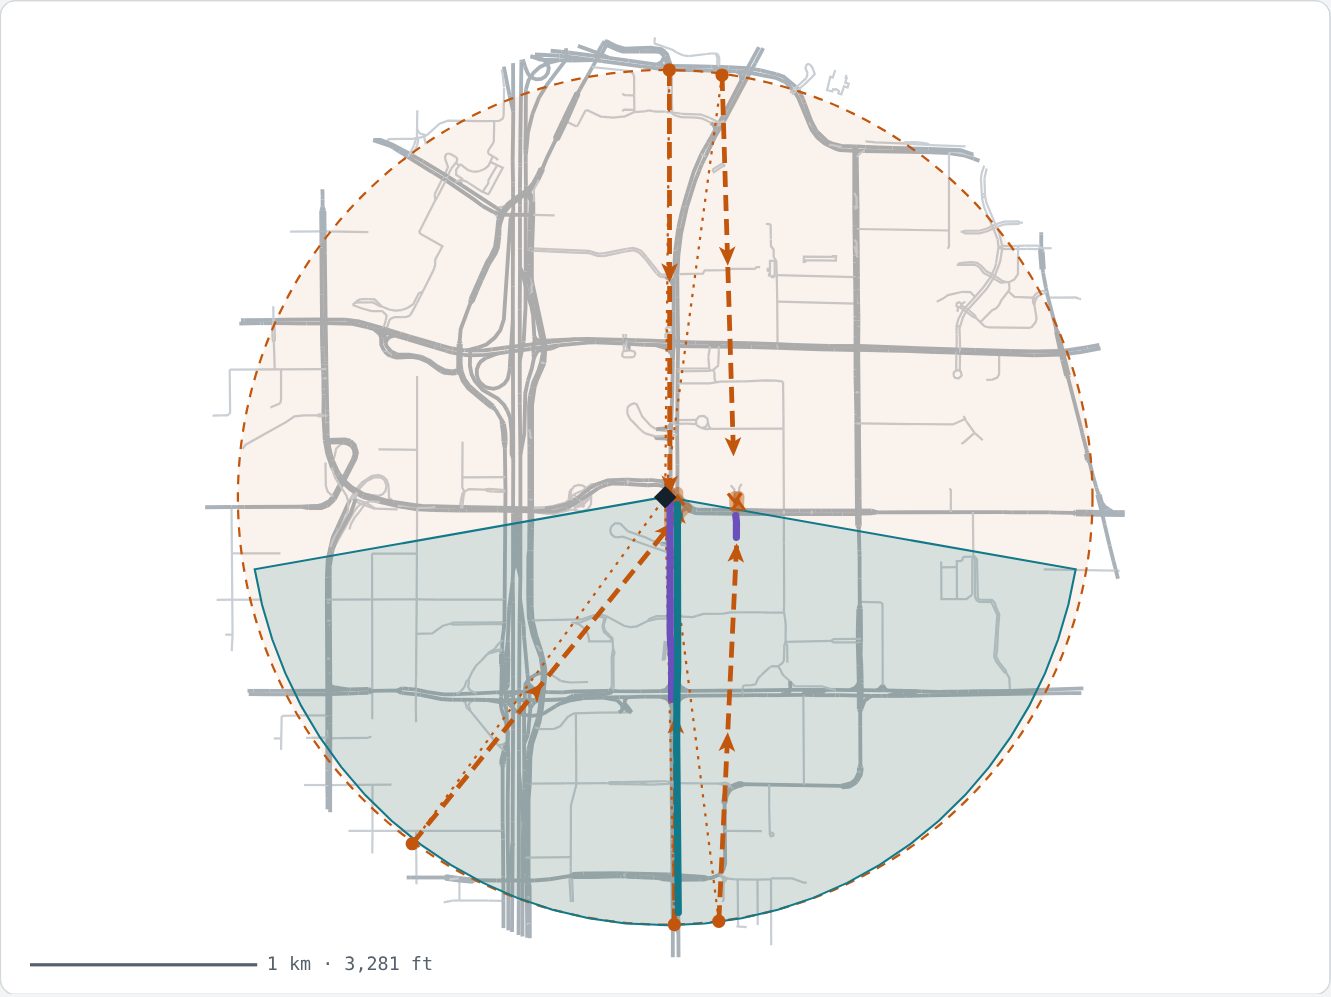
Both effects on one board. Northbound, the Strip runs straight at the board, so the Motionworks path is 0.97× the Geopath line and the time-in-view gap is speed: Geopath 640 s at 7 mph against a delivered 280 s at 14.3 mph, 2.3×. On the northeast approach the Motionworks path is 62 ft against a 5,967 ft line, so geometry dominates.
| Distance in view, same roads only | Geopath | Motionworks | Typical per-road ratio |
|---|---|---|---|
| Vehicle (ft) | 955 | 828 | 0.83 |
| Pedestrian (ft) | 376 | 151 | 0.79 |
| Faces with maximum viewing distance of 5,000 ft or more: Motionworks path ÷ Geopath line (median) | 0.06 |
Averages are person-weighted; the ratio column is computed road by road, as in the speed table. Road by road, distance explains about 30% of the vehicle time-in-view difference and speed about 70%. Weighted by OTS, the split is closer to 40 / 60 (-18 and -27 points in the digital bridge above). Both only affect OTS on digital faces.
Two numbers that reconcile.
Every Motionworks campaign report can be bridged to the Geopath plan, input by input. Across the whole national roadside inventory, static and digital together, Motionworks OTS lands 12% above the plan: 15.6 points from people, 3.2 points back from speed and distance on digital faces, and a 0.4 point remainder. Components are rounded to one decimal, so a hand sum can differ by 0.1.
Static campaigns
Expect delivered OTS near or above the plan. The difference is people counted, and it is widest on faces where the viewshed reaches roads that are not assigned.
Digital campaigns
Expect delivered OTS below the plan, often by a quarter or more, with higher reach. Shorter time in view means fewer repeat loops per person, while more people are counted. In one New York campaign the report showed 0.31× the planned impressions and 2.40× the planned reach.
How the comparison was checked
| Check | What was tested | Result |
|---|---|---|
| Geopath's time in view is reproduced from Geopath's own inputs | Approach line length divided by the Geopath speed input equals Geopath's reported time in view, assignment by assignment. | r = 0.998 · median ratio 1.000 |
| Motionworks time in view is reproduced from Motionworks inputs | Path length divided by the observed speed equals the delivered time in view. | median ratio 1.00 |
| Both sides follow the digital formula | The small remainder on each side is carried as its own line in the bridge. | GP +3% · MW -2% |
| The bridge sums exactly | Every road is in one bucket. People, distance, speed and remainder add to the observed total on every cut. | +15.6 -1.3 -1.9 -0.4 = +12.0 |
Measurement, not a verdict.
Motionworks does not set the definition of an impression or the rules of the currency. Geopath does. What we provide is the population model underneath: who passed, how fast, and from where the sign was visible. A campaign report shows what that model measured, and this page shows how it relates to the plan.
Where the two differ, both are stated. Where our inputs still need work, we say so. The speed comparison above is ten corridors, not a national validation, and we continue to extend it.
Notes and sources
- National comparison. A stratified sample of 36,540 roadside faces, weighted to the 539,759 faces in the Motionworks 2026 forecast: thirty faces from every state, every top-10 DMA, each media type, each place type, static and digital. Same roads are matched through the Pathcast crosswalk. Intervals are 95%, from a stratified bootstrap, and cover sampling error only.
- Geometry. Geopath delivery 20261014. Approach lines are drawn from Geopath's published roadside geometry formula along the assigned segment's direction; Geopath does not store the line itself. Motionworks viewsheds and published paths from the same delivery window. Streets from OpenStreetMap, October 2026.
- Speed check. Ten corridors, six-month hourly averages ending February 2026. Government sources: CTA Bus Travel Time (Chicago), NYC DOT speed sensors (New York), Caltrans PeMS (California).
- Scope. OTS only. LTS is OTS times a visibility factor on both sides; the visibility factor is not compared on this page. Digital is about 7% of Geopath roadside OTS (about 4% of Motionworks roadside OTS, since digital lands below plan while static lands above), so the all-faces figure mostly reflects static faces.